 This is the 10th year I have tracked car usage, so I think it's safe to say this has
become a habit. As has the nerdy tracking and graphing of it in
Microsoft Excel. (You can check out 2017 here, 2016 here, 2015 here, 2014 here, 2013 here, 2012 here, 2011 here, 2010 here, and 2009 here.)
This is the 10th year I have tracked car usage, so I think it's safe to say this has
become a habit. As has the nerdy tracking and graphing of it in
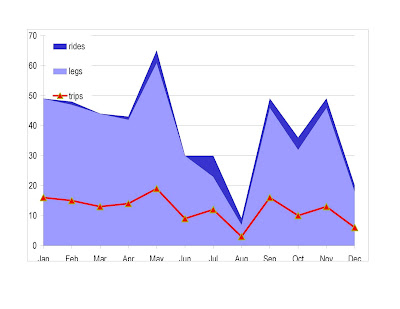
Microsoft Excel. (You can check out 2017 here, 2016 here, 2015 here, 2014 here, 2013 here, 2012 here, 2011 here, 2010 here, and 2009 here.)As before, the Philly totals represent, in order, number of trips, number of legs represented in those trips (i.e. going to and from my in-laws, making one stop to get gas, counts as three legs), and number of legs in which I was driven (rather than driving).
The other city totals represent, in order, number of times I was in that location, number of days I was in that location, number of trips, number of legs represented in those trips, and number of legs in which I was driven.
Jan 16/49/0 Trenton 1/1/0/0/2
Baltimore 1/1/1/6/0 South Bend 1/2/0/0/2
Feb 15/47/1 Dallas 1/2/0/0/3
Wilmington 2/2/0/0/0 Allentown 1/1/1/2/0 Newark DE 1/1/1/2/0 Poconos/Baltimore
1/1/1/8/0
Mar 13/44/0 SoCal 1/2/2/9/0 New
Brunswick 1/1/0/0/0
Apr 14/42/1 South Bend 1/2/1/5/0 Baltimore 1/1/1/6/0
May 19/61/4 Baltimore 2/2/2/8/0
Columbus 1/1/0/0/3
Jun 9/30/0 Newark NJ 1/1/1/2/0
Baltimore 1/1/1/3/0 DC 2/5/2/5/1 Poconos 1/2/4/10/0
Jul 12/23/7 Miami 1/4/4/8/2
Iroquoina/Greenwood 2/2/2/5/0
Aug 3/7/2 Phoenix 1/4/0/0/6 DC
1/1/0/0/0 Rehoboth Beach 1/8/10/23/0 SJ 1/1/0/0/6 Greenwood 1/1/1/2/0
Sep 16/46/3
Oct 10/32/4 Rehoboth Beach 1/3/4/9/0
Bethlehem 1/1/1/4/0 Milwaukee 1/3/0/0/1 Wilmington 1/1/0/0/0
Nov 13/46/3
Dec 6/18/2 SJ 1/8/15/43/2 NYC
1/1/0/0/0 Newark NJ 1/1/0/0/1
So my Philly total is 146 trips involving 445 legs, plus another 27 legs in which I was driven. So that works out to about 12 car trips and 39 legs a month. A few takeaways from this exercise:
1. Bundling trips is good for the environment, since it's more efficient to drive a warm car than a cold one. Glad to see my "legs per trip" is well above the usual 2 (there and back) and is really closer to 3.
2. Ride-share plus transit investment has meant far less driving in places you used to have to rely on your own car to get around in, like Phoenix and Dallas.
3. It is only now that I am tallying up these numbers that I realized I only went to DC twice and New York once in 2018. One of the great selling points of Philly, of course, in addition to being its own legit big city, is access to the nation's financial and political capitals. I like to say that I can do a day's worth of business in either city and still see my kids in the morning and evening (and not need a car at any point in the day, too), which is a great plus.


No comments:
Post a Comment