 This is the sixth year I have tracked car usage, so I think it's safe to
say this has become a habit. As has the nerdy tracking and graphing
of it in Microsoft Excel. (You can check out 2013 here, 2012 here, 2011 here, 2010 here, and 2009 here.)
This is the sixth year I have tracked car usage, so I think it's safe to
say this has become a habit. As has the nerdy tracking and graphing
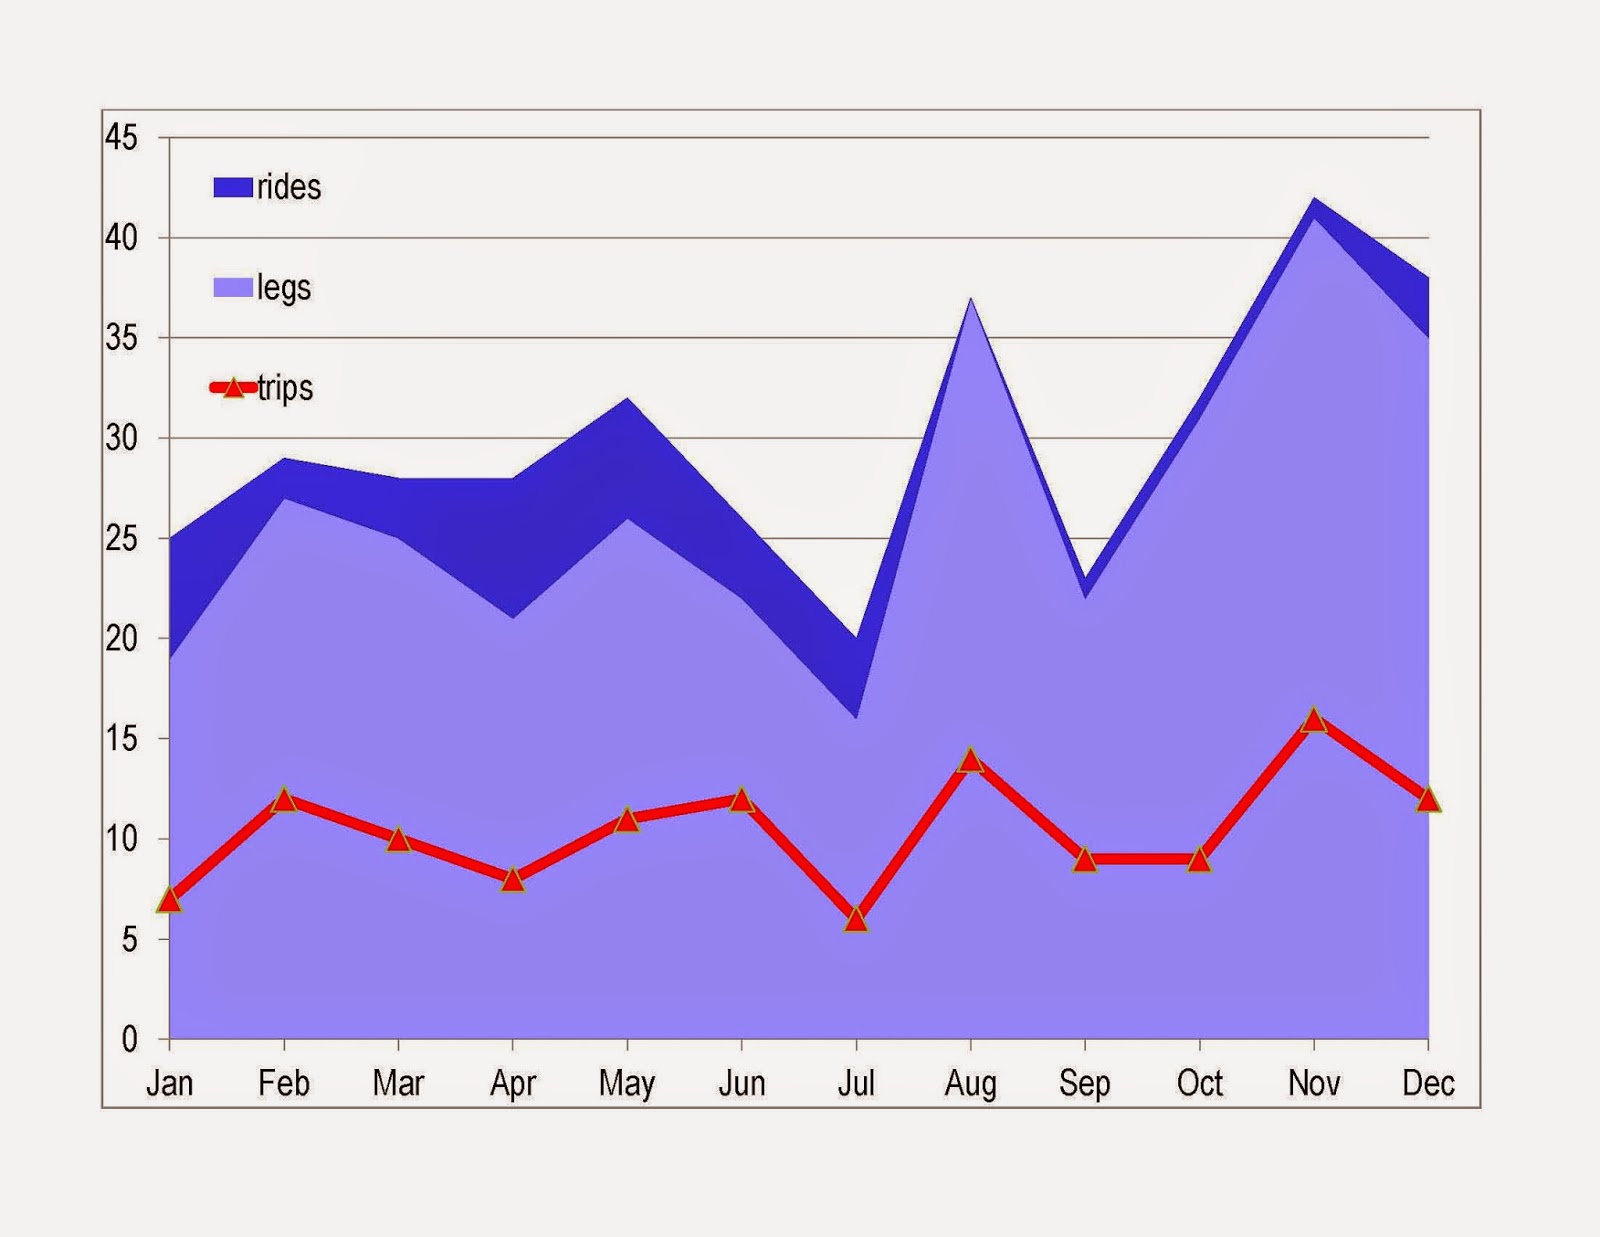
of it in Microsoft Excel. (You can check out 2013 here, 2012 here, 2011 here, 2010 here, and 2009 here.) As before, the Philly totals represent, in order, number of trips, number of legs represented in those trips (i.e. going to and from my in-laws, making one stop to get gas, counts as three legs), and number of legs in which I was driven (rather than driving). The other city totals represent, in order, number of times I was in that location, number of days I was in that location, number of trips, number of legs represented in those trips, and number of legs in which I was driven.
January 7/19/6
February 12/27/2
March 10/25/3
April 8/21/7 Arkansas 1/1/1/7/0
May 11/26/6 Pittsburgh 1/1/1/6/0
Jun 12/22/4 Connecticut 1/1/1/6/0
Jul 6/16/4 Hershey 1/3/3/9/0
Aug 14/37/0 DC/Wbg 1/8/12/34/0
Sep 9/22/1
Oct 9/31/1 Hershey 1/1/1/4/0
Nov 16/41/1
Dec 12/35/3 SJ 1/8/13/36/2 Baltimore 1/1/0/0/0 NYC 1/1/0/0/0
So my Philly total is 126 trips involving 322 legs, plus another 38 legs in which I was driven. So that works out to about 10 car trips a month, and 1 leg per day. A hair more than before, which I chalk up to the kids having more extra-curriculars that involve driving as well as a flurry of furniture shopping (and returning and exchanging, groan!).


No comments:
Post a Comment