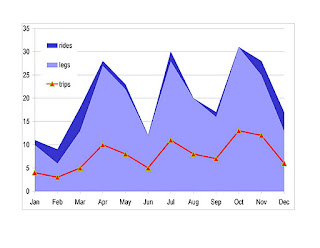
This is the third year I have tracked car usage, so I think it's safe to say this has become a habit. As has the nerdy tracking and graphing of it in Microsoft Excel. (You can check out 2010 here and 2009 here.)
As before, the Philly totals represent, in order, number of trips, number of legs represented in those trips (i.e. going to and from my in-laws, making one stop to get gas, counts as three legs), and number of legs in which I was driven (rather than driving). The other city totals represent, in order, number of times I was in that location, number of days I was in that location, number of trips, number of legs represented in those trips, and number of legs in which I was driven.
Philadelphia 92/223/21
Harrisburg 4/4/0/0/0
Kentucky 1/2/1/4/0
New York City 2/2/0/0/0
Ocean City 1/7/4/9/0
Pittsburgh 1/2/0/0/2
St. Thomas 2/10/4/11/33
San Diego 1/3/0/0/5
San Jose 3/21/19/46/18
Washington DC 1/1/0/0/4
Yet again, I was able to average far fewer than one leg per day, thanks to our urban setting and the many everyday locations I can get to without a car. Here's hoping that that delays when we need to purchase a new car, and that it makes a difference for the environment.
.jfif)

No comments:
Post a Comment